


Hello StandOut friends!
Today’s post concludes our Year in Review series, where we’re looking back at release updates from the past 12 months to catch you up on anything that you may have missed. Part 1 of this series can be found here, and focuses on enhancements and updates intended to help you infuse a strengths culture into your organization. 💪 Part 2 is here, and reviews all the ways that StandOut has brought you new flexibility and automation to meet your organizations unique needs. 🤸 Part 3, found below, shares all the StandOut enhancements that have brought you more visibility into how things are going across your organization. 👀 Please read on below!
As always, you can check out the Near-Term Roadmap for details on what to expect next from StandOut. 🔮
💪 Other fun strengths news for you this cycle:
-
Don’t miss our new Engagement Pulse Series! Read on to learn more about these survey questions:
-
Employee sentiment dropped this month, see the data and insights here. 📉
-
Wages & hiring: it’s complicated! 💸
StandOut Year in Review: Giving you better visibility into how it’s going
We’re always looking for input from our users to help shape what's next for StandOut, and we’re pleased to have delivered on many client-requested enhancements to reporting this year. See below for recent updates that better support practitioners in their understanding of engagement across teams and the impact of StandOut on your organization.💥
StandOut Insights 📊
One of our most highly anticipated updates of the year was the introduction of StandOut Insights in the October release. This new feature analyzes StandOut data to create meaningful stories about your organization’s engagement journey, available in a ready-made presentation format. These stories can be easily shared with anyone in your organization, offering a simple and effective way to communicate the positive impact of StandOut so that you can do more of what’s working.
Please check out the video below to learn more:
Engagement Pulse Reporting Enhancements 📈
Engagement Pulse Results Sharing: It’s easier than ever to share Engagement Pulse results with your team and other individuals across your organization, thanks to new sharing capabilities delivered in the January release. A simple click of a button will deliver results to intended recipients via email and in-platform notifications. Leaders have been using this new capability to let their teams preview results prior to their debrief sessions and to share with other leaders and mentors.
Here’s a video to learn more:
Deactivated Team Engagement Pulse Responses: In December, we updated Engagement Pulse functionality so that members of teams that are deactivated mid-survey may still respond even though their team no longer exists, with their responses rolling up to organization-level reporting. Supporting users on deactivated teams to have their voices heard will lead to higher response rates, resulting in higher quality data that is more representative of the organization and will better equip leaders to continue moving engagement forward.
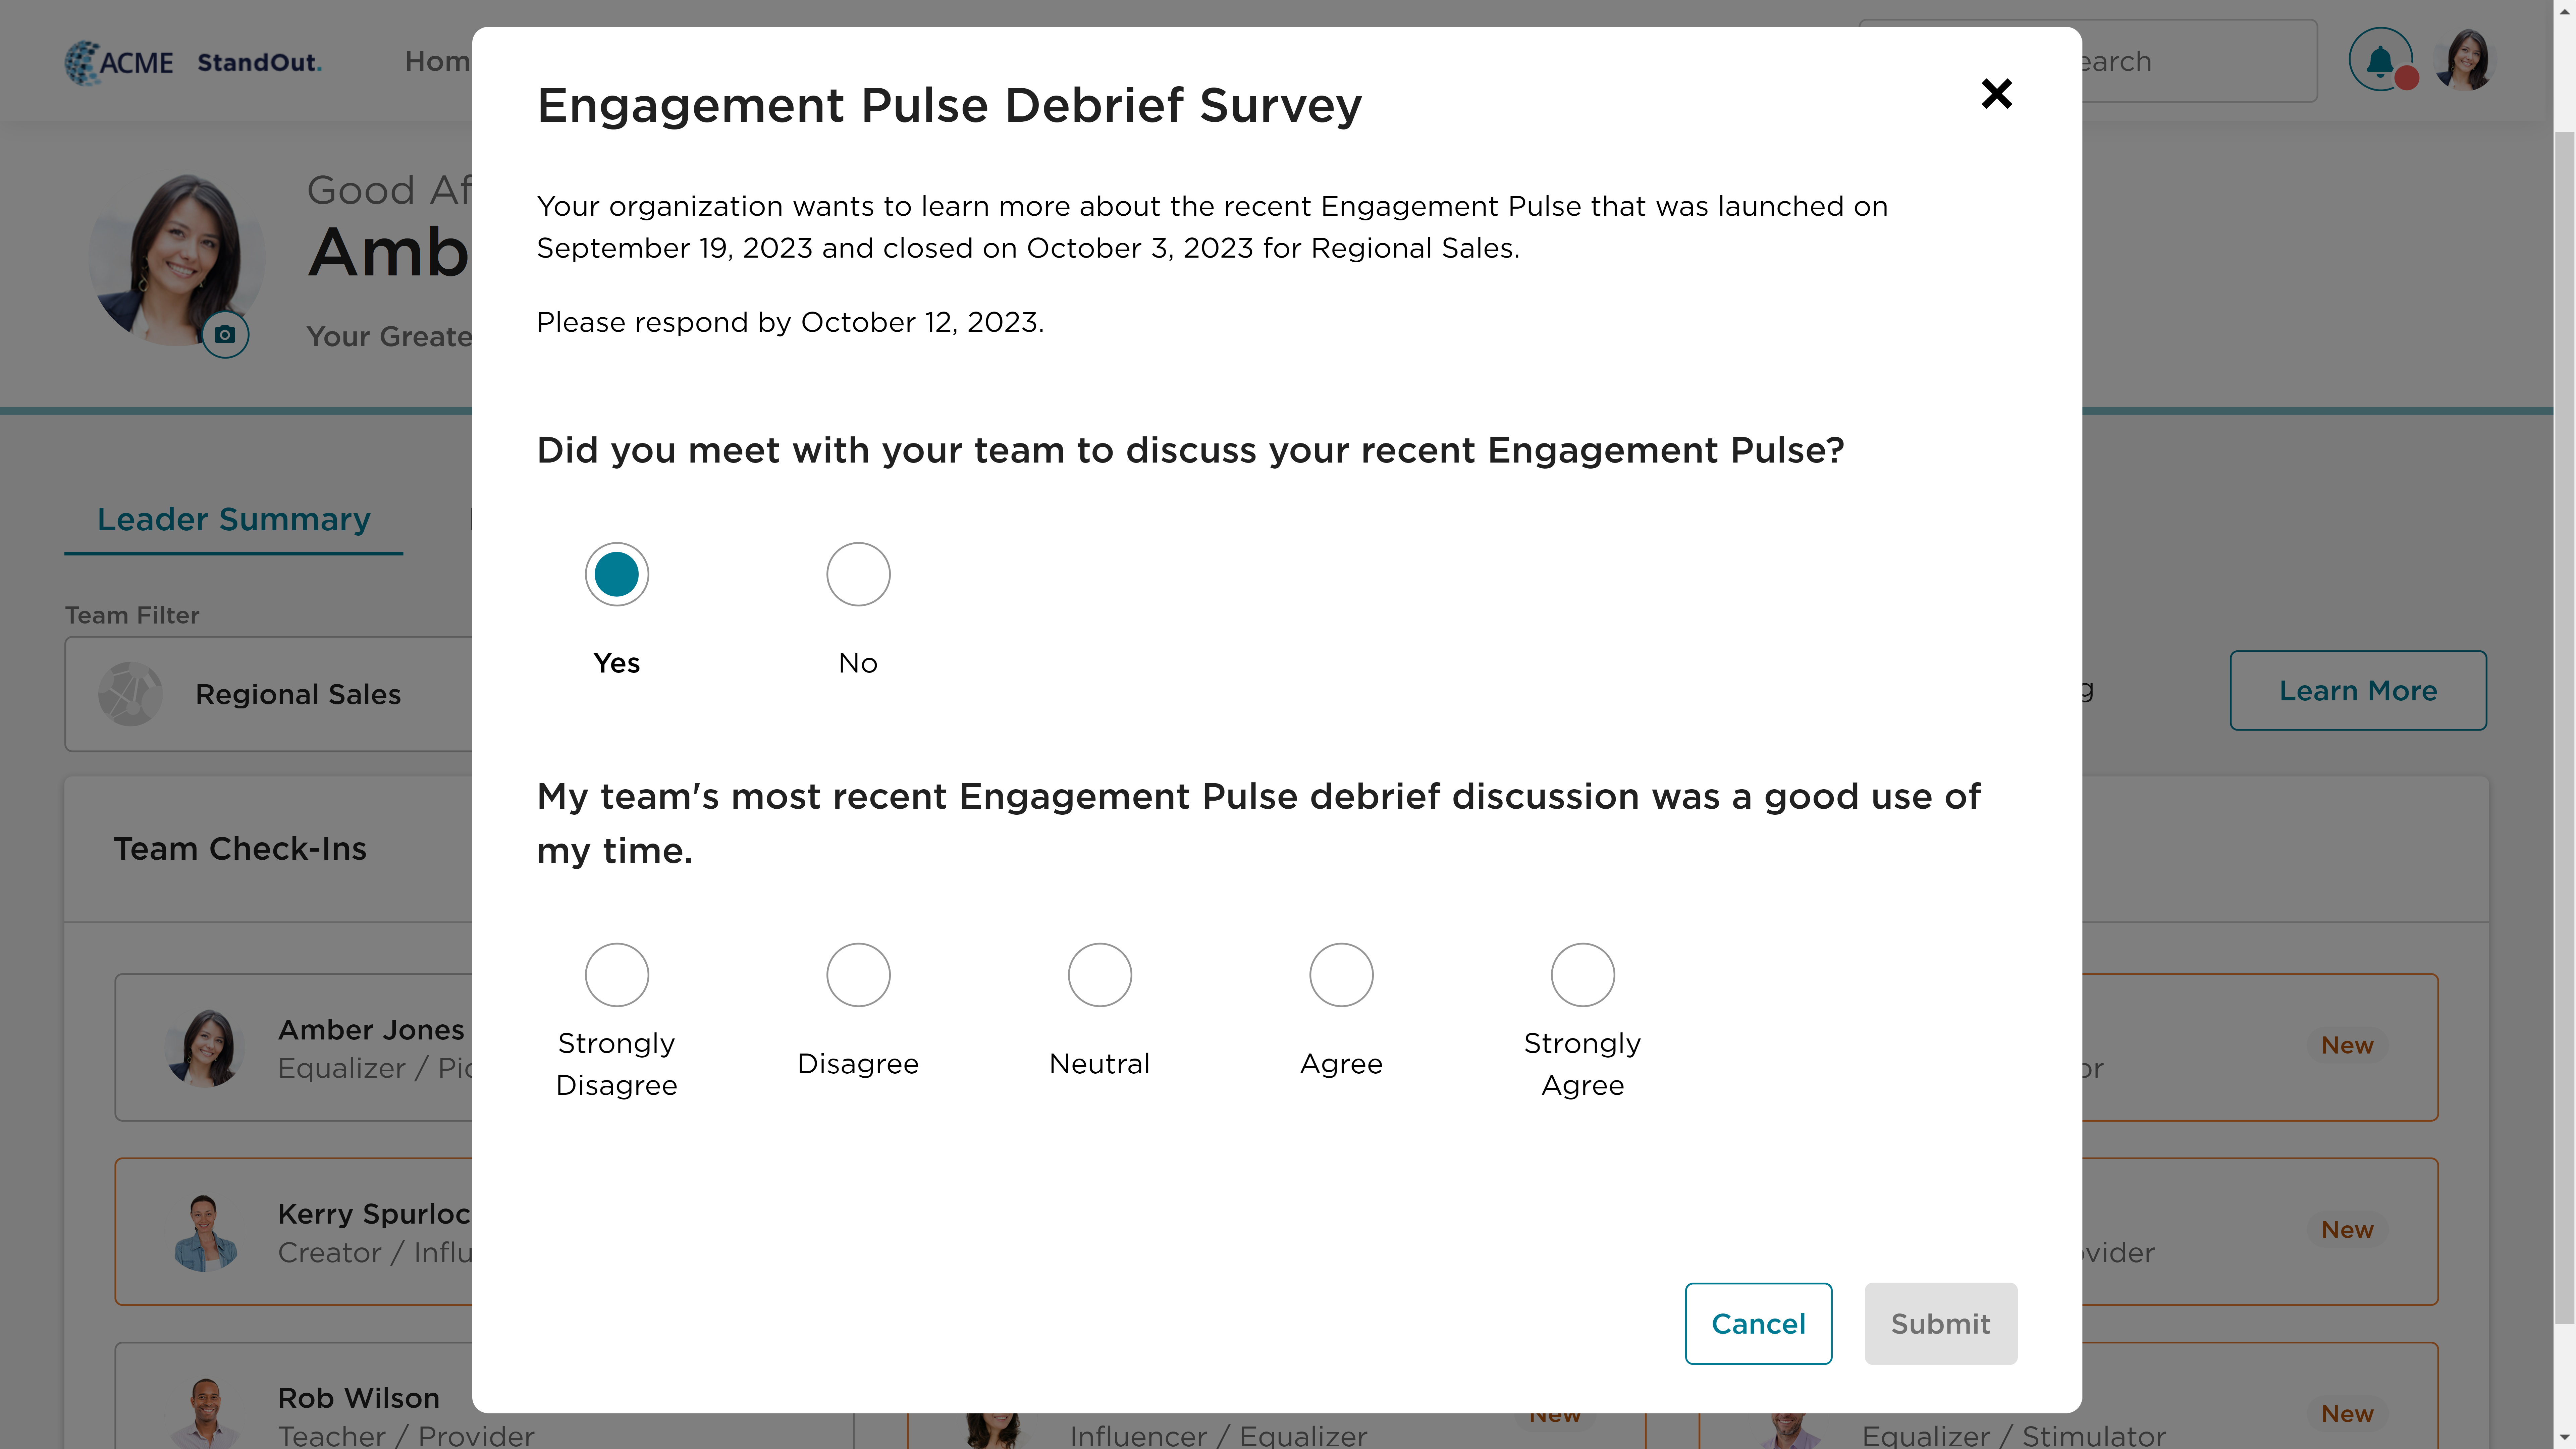
Engagement Pulse Debrief Tracking: With the October release, we introduced a new survey to measure the actions that team leaders are taking with their Engagement Pulse results. This enhancement was requested by several clients, who are now using the information provided to support their leaders in better supporting their teams.

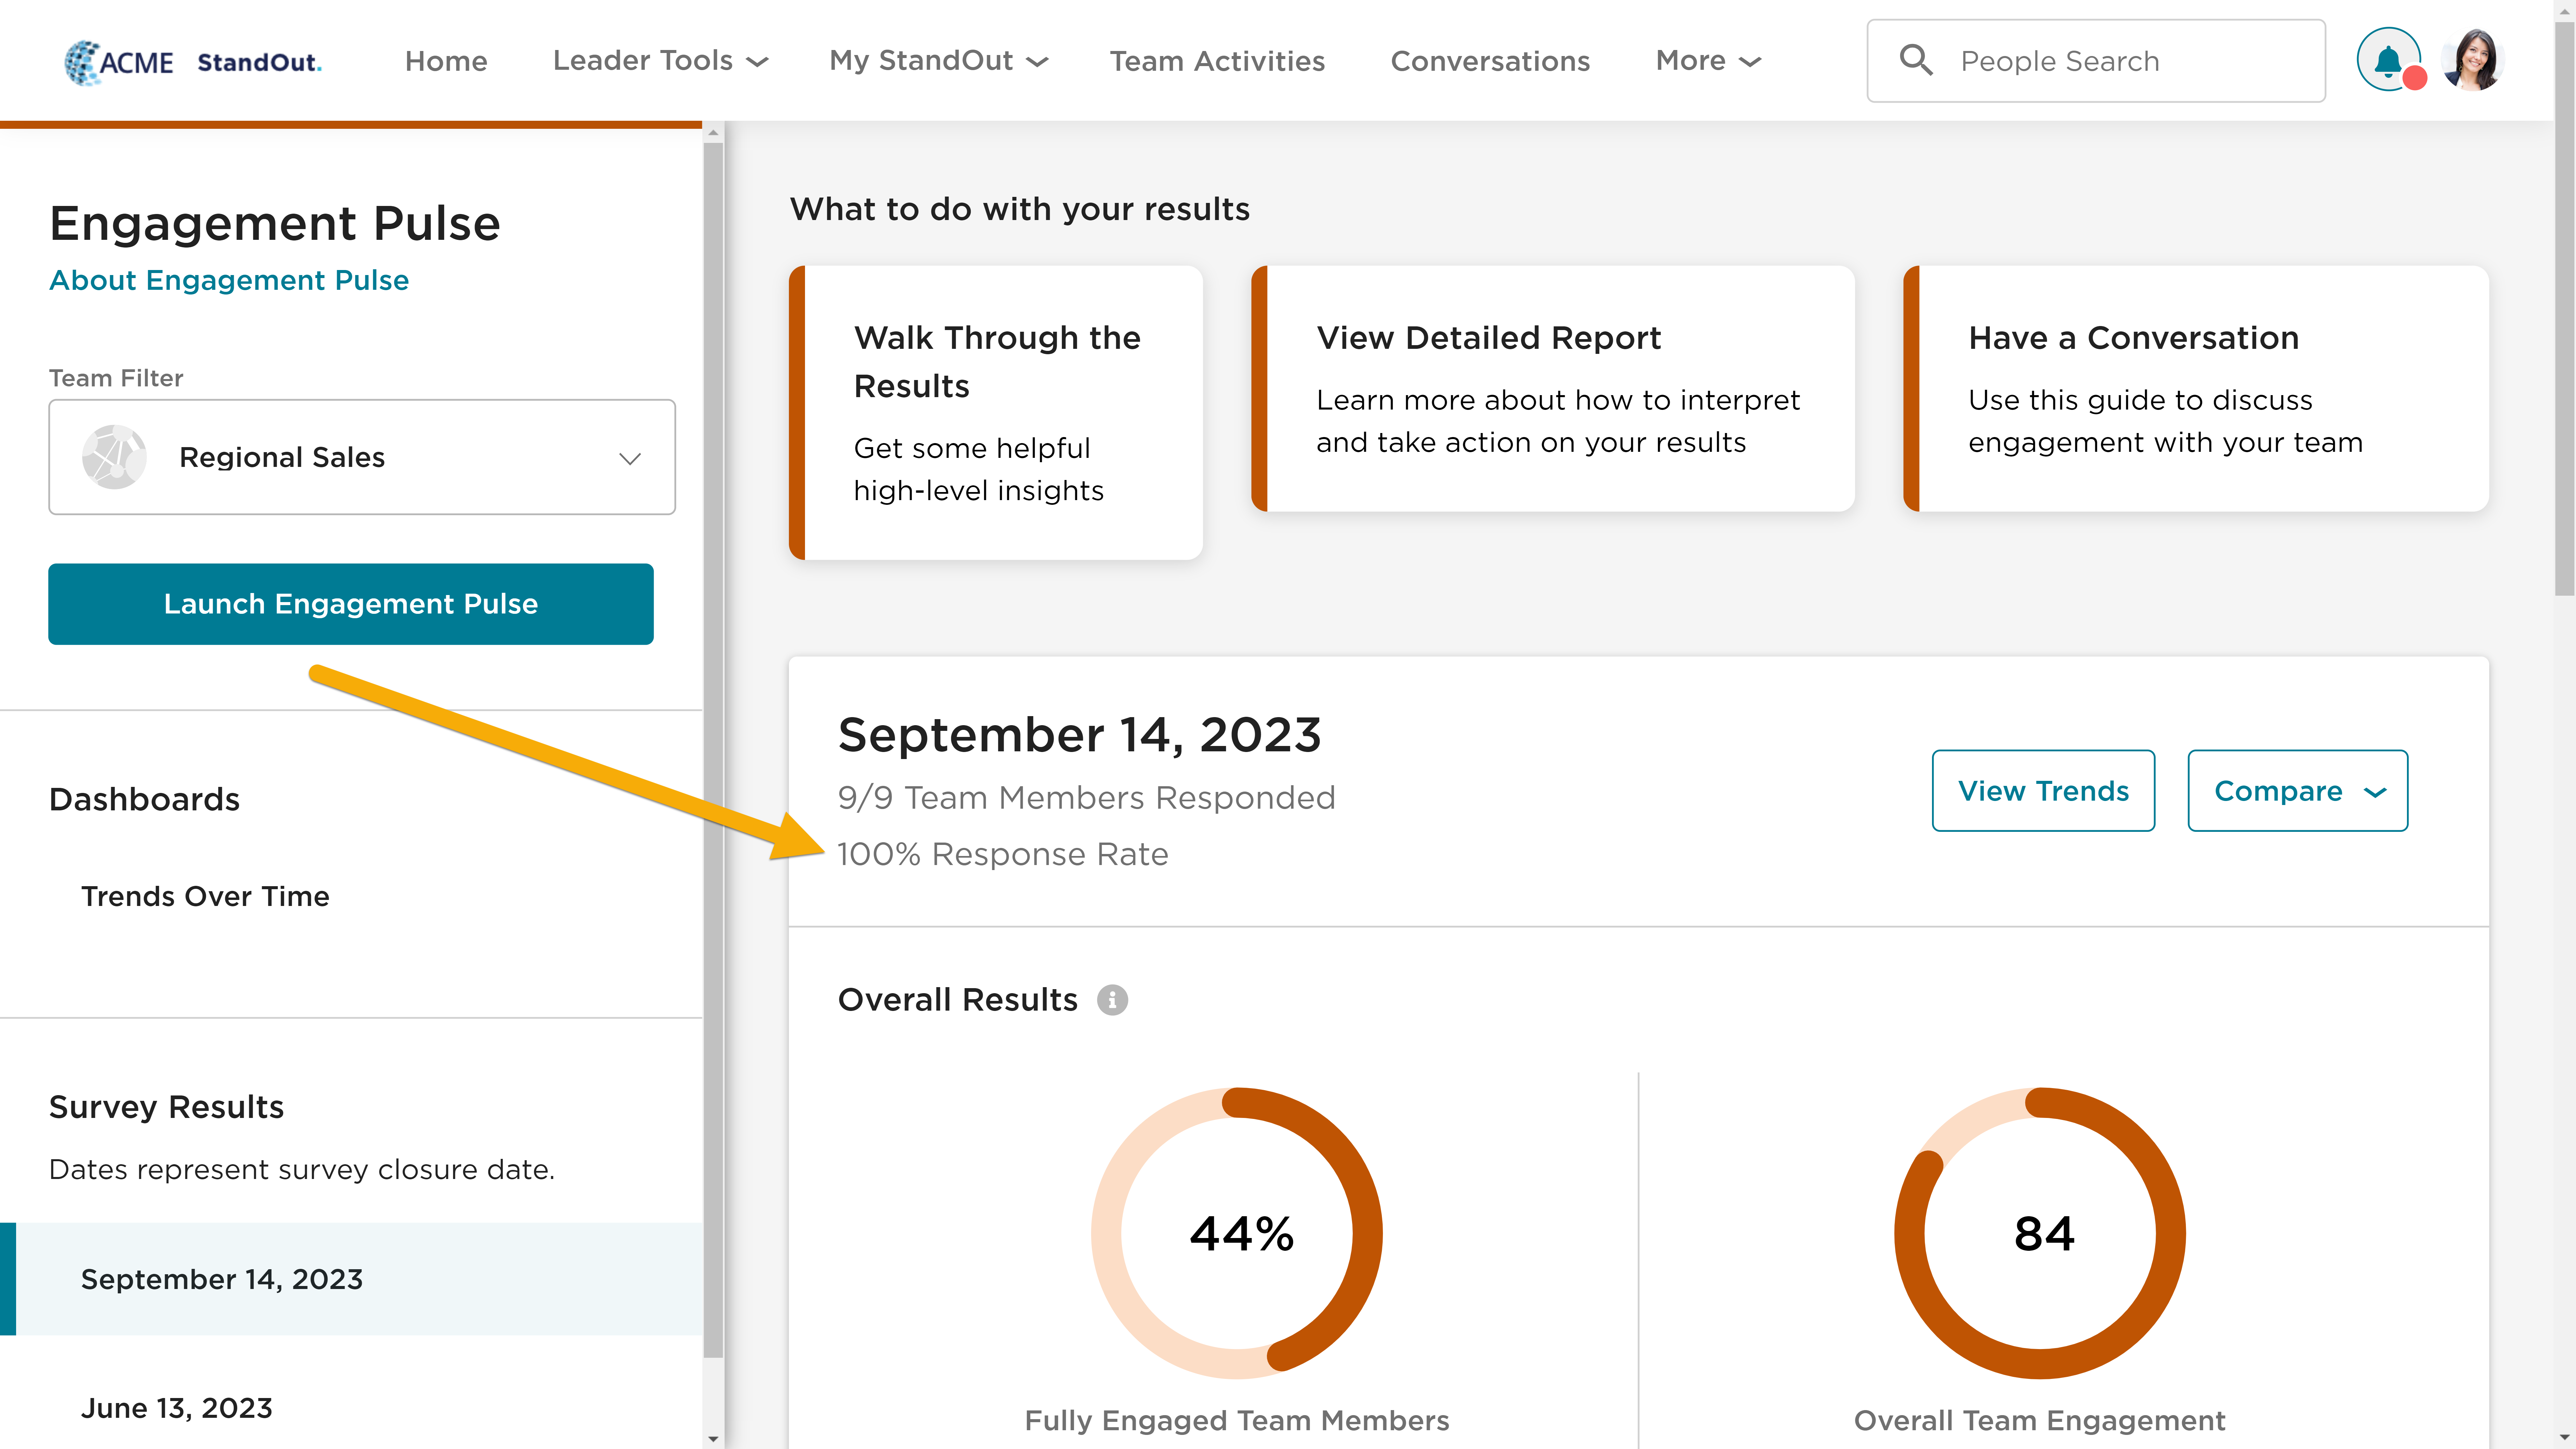
Engagement Pulse % Response Rate: In an effort to make StandOut reporting feel as easy as possible, we’ve added the % Response Rate to Engagement Pulse reporting--this was previously shown as a fraction only.
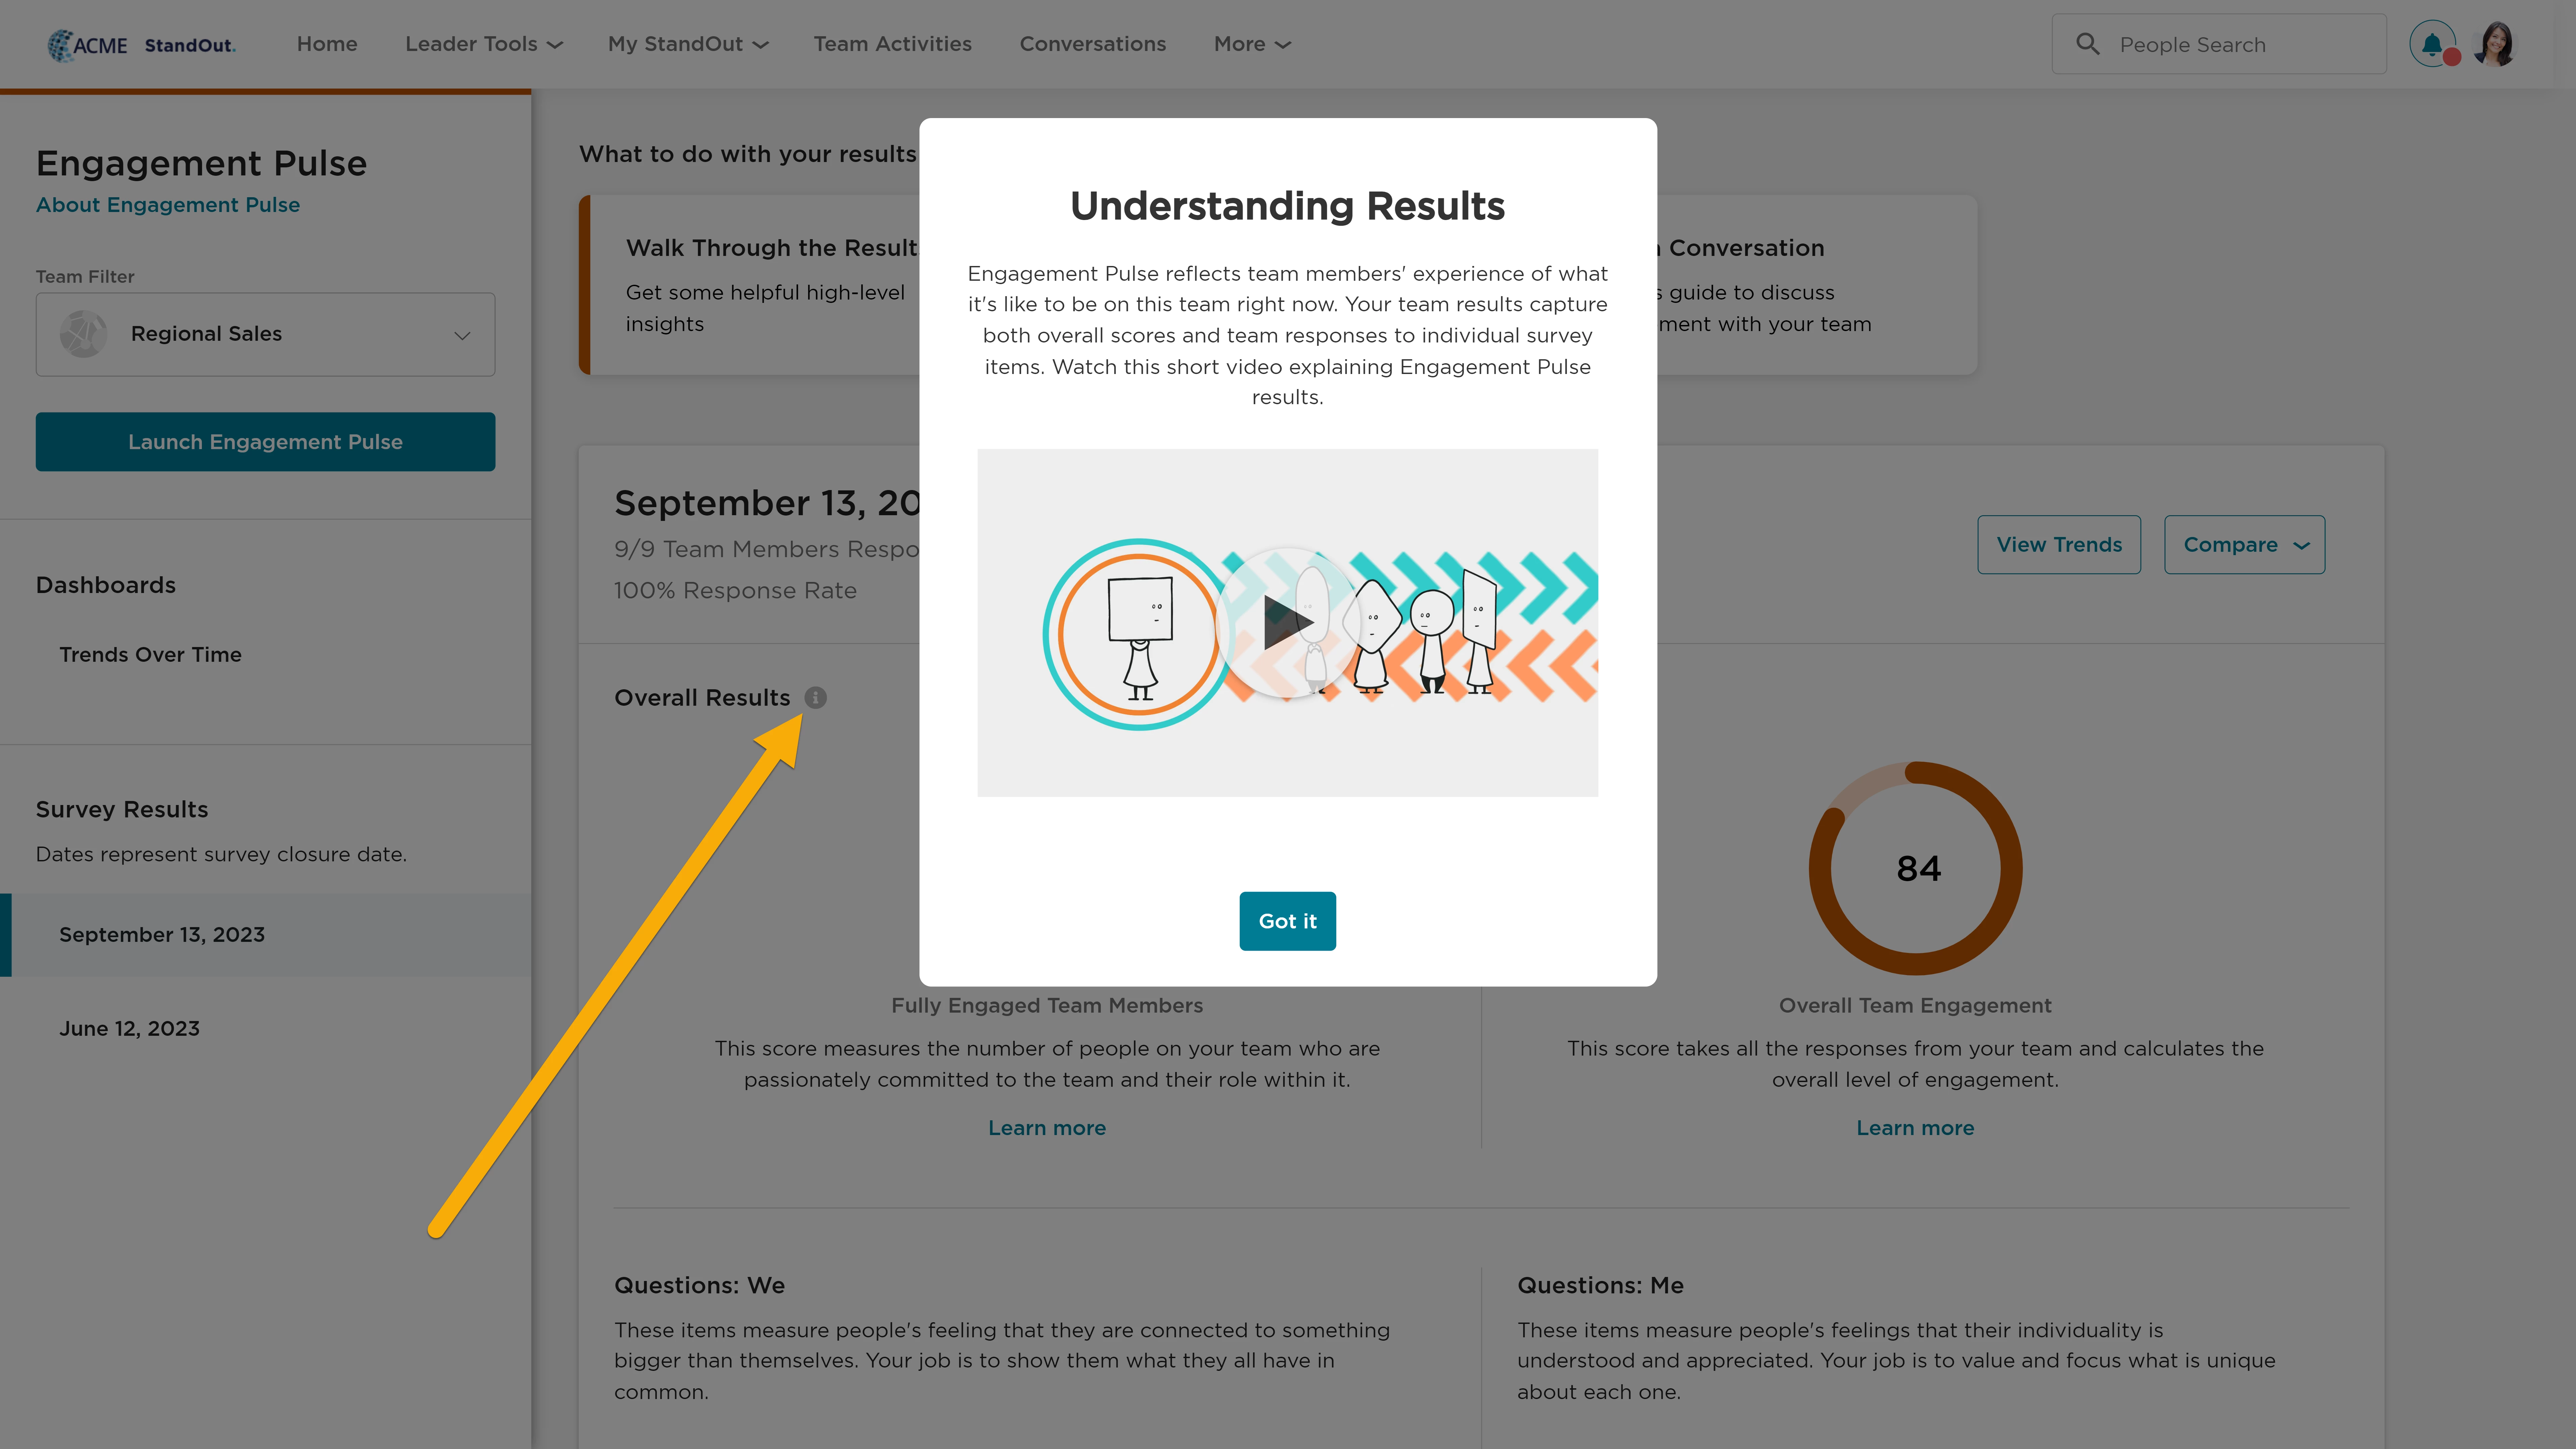
New Engagement Pulse Results Video: In October, we added a new video linked next to Overall Results on the Engagement Pulse page. This video walks leaders through how Engagement Pulse results are calculated and what they mean, providing helpful context as you consider your team results.
Engagement Pulse Usage Report Update: In March, we added two new data points to the Engagement Pulse Usage Report to support our newest Engagement Pulse reporting metrics and to help organizations better understand what leaders are doing with results:
- Date Viewed: the date that the Team Leader first viewed their Engagement Pulse results (subsequent views will not impact this date).
- Date Shared: the date that the Team Leader first shared a set of Engagement Pusle results with either their entire team or any individual (subsequent shares will not impact this date).
Chart Exports
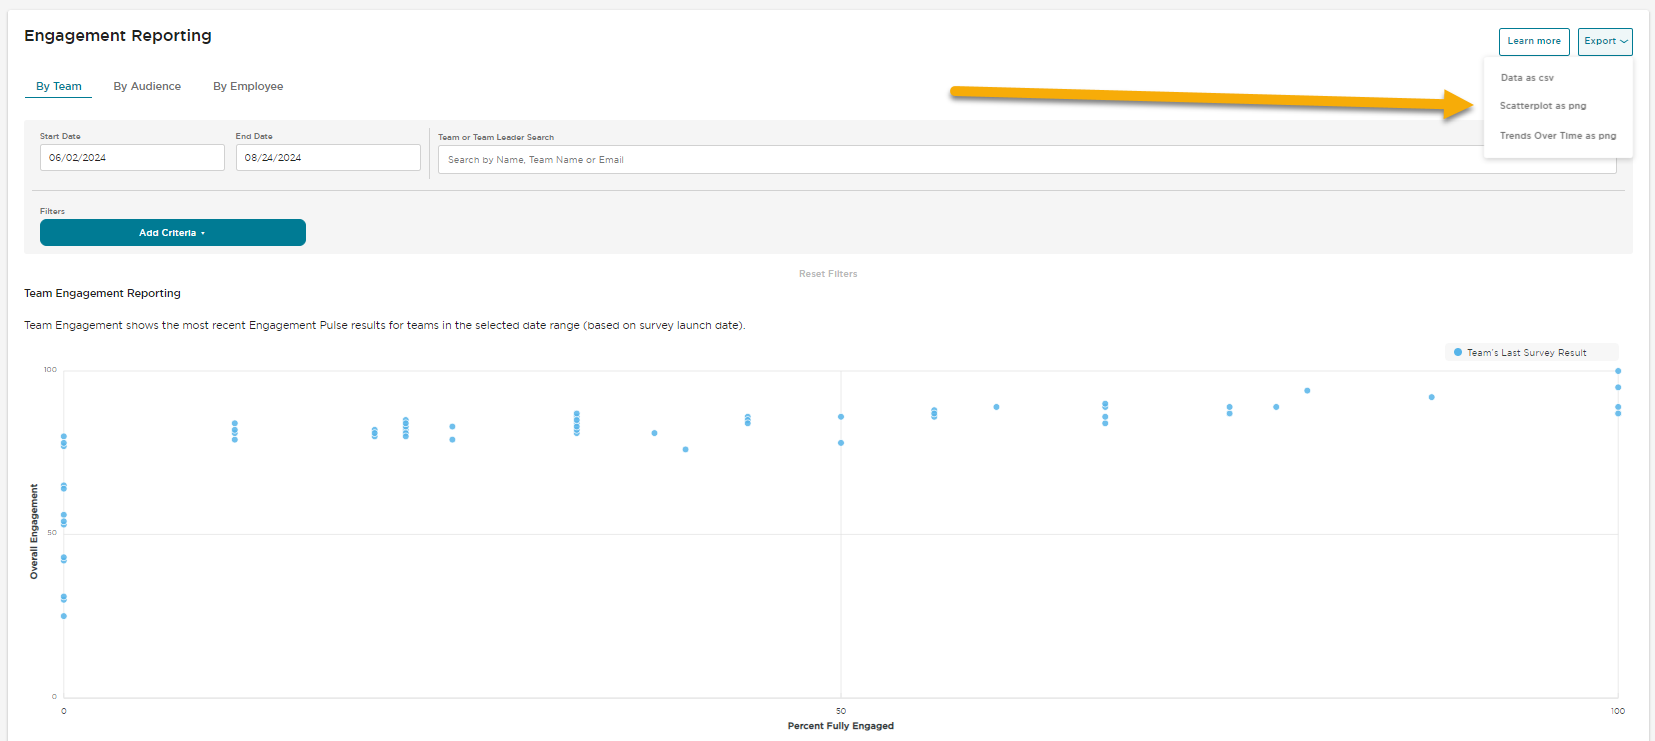
In March, we were pleased to deliver on a client-requested enhancement that makes sharing StandOut reporting within your organization even easier with the ability to export reporting charts. Charts from StandOut Reporting and StandOut Admin→ Engagement Pulse can now be exported as a PNG or PDF, so you can easily include them where needed to improve buy-in and make talent decisions.
Roll-Up Reporting Enhancements
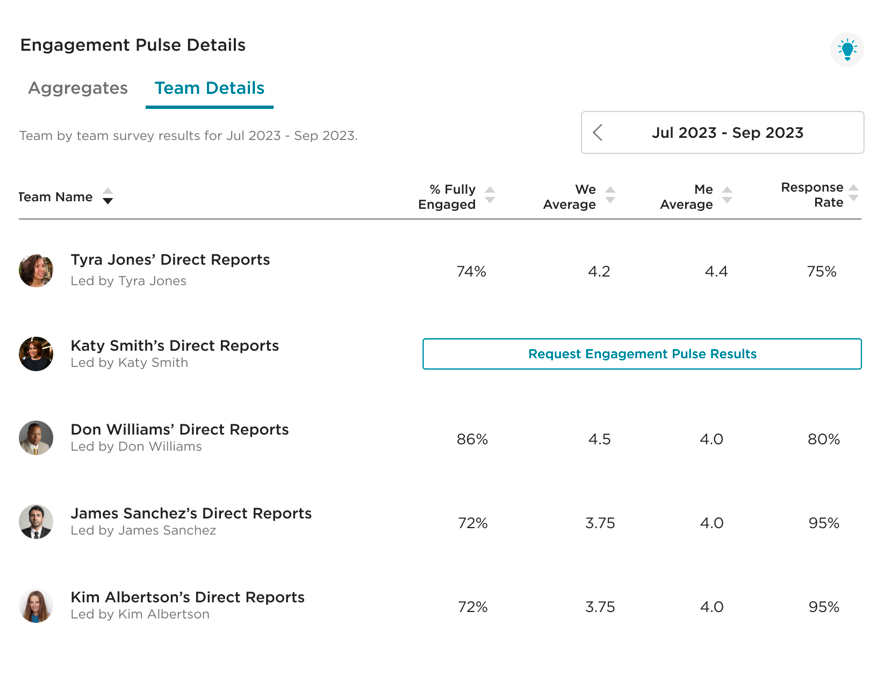
Our April release brought leaders of leaders even better visibility into engagement across their teams with the addition of team-by-team breakdowns of the Roll-Up Reporting metrics found in the Leader Summary. In addition to the aggregate view that shows Engagement Pulse scores and Check-In trends for all team members rolling up to them (their direct team + 1 level below), they can now see these metrics broken out by team, providing them further insights into how things are going.
Additionally, there are convenient buttons built right into the reports, allowing leaders to “Request Engagement Pulse Results” from any direct reports who have not yet shared them, and “Nudge Team Leader” to encourage their direct reports to view available Check-Ins for their teams.
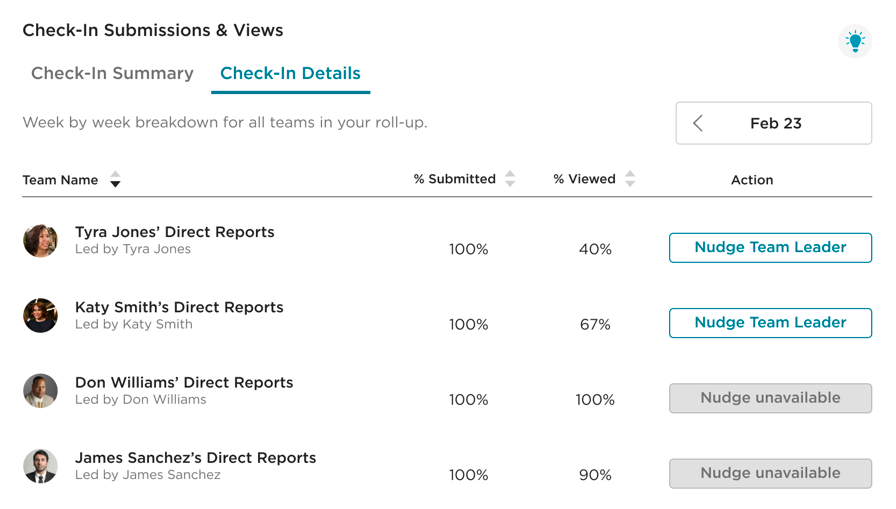
Check-In Reporting Enhancements
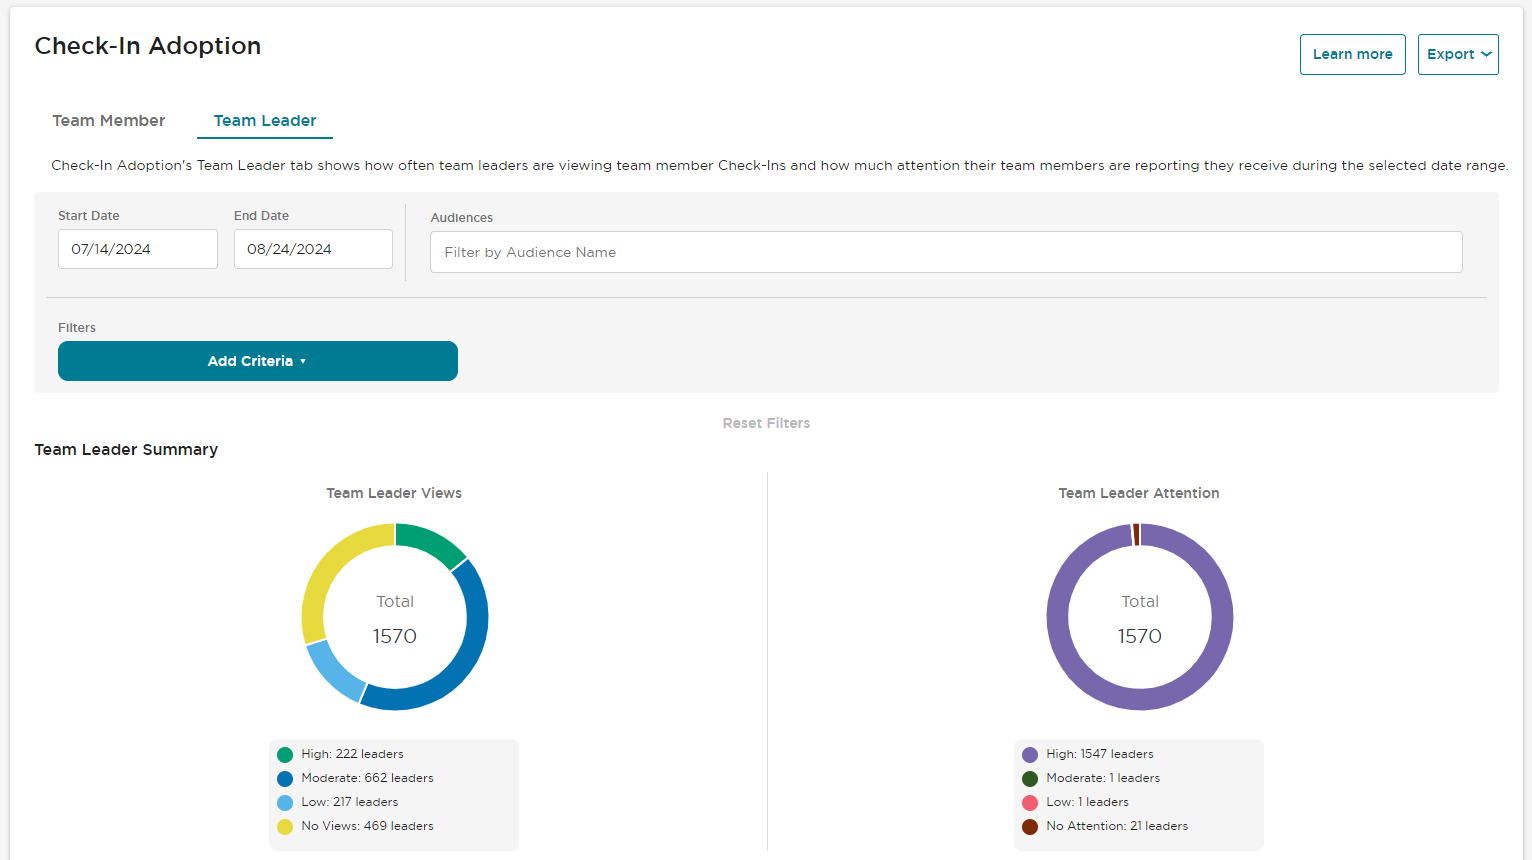
Our April release also brought StandOut practitioners several enhancements to Check-In Reporting to further support them in driving Check-In adoption throughout their organizations. New tabs were added within the Check-In Reporting section, showing new views of team leader Check-In Views & Attention. This improved visibility into Check-In metrics reduces practitioner lift needed to understand usage and attention across the organization, so you can focus your time less on data sorting and more on sharing out the many benefits of Check-Ins.
What a year! We’re excited to bring more enhancements your way in the coming months. As always, please let us know any ideas you have to help StandOut better support you!